com.codename1.charts.ChartComponent Maven / Gradle / Ivy
/*
* Copyright (c) 2012, Codename One and/or its affiliates. All rights reserved.
* DO NOT ALTER OR REMOVE COPYRIGHT NOTICES OR THIS FILE HEADER.
* This code is free software; you can redistribute it and/or modify it
* under the terms of the GNU General Public License version 2 only, as
* published by the Free Software Foundation. Codename One designates this
* particular file as subject to the "Classpath" exception as provided
* by Oracle in the LICENSE file that accompanied this code.
*
* This code is distributed in the hope that it will be useful, but WITHOUT
* ANY WARRANTY; without even the implied warranty of MERCHANTABILITY or
* FITNESS FOR A PARTICULAR PURPOSE. See the GNU General Public License
* version 2 for more details (a copy is included in the LICENSE file that
* accompanied this code).
*
* You should have received a copy of the GNU General Public License version
* 2 along with this work; if not, write to the Free Software Foundation,
* Inc., 51 Franklin St, Fifth Floor, Boston, MA 02110-1301 USA.
*
* Please contact Codename One through http://www.codenameone.com/ if you
* need additional information or have any questions.
*/
package com.codename1.charts;
import com.codename1.charts.models.Point;
import com.codename1.charts.models.SeriesSelection;
import com.codename1.charts.renderers.XYMultipleSeriesRenderer;
import com.codename1.charts.views.AbstractChart;
import com.codename1.charts.views.XYChart;
import com.codename1.ui.Component;
import com.codename1.ui.Display;
import com.codename1.ui.Form;
import com.codename1.ui.Graphics;
import com.codename1.ui.Transform;
import com.codename1.ui.animations.Animation;
import com.codename1.ui.animations.Motion;
import com.codename1.ui.geom.Dimension;
import com.codename1.ui.geom.GeneralPath;
import com.codename1.ui.geom.Rectangle;
import com.codename1.ui.geom.Shape;
import java.util.ArrayList;
/**
* The top level component for displaying charts
*
The charts package enables Codename One developers to add charts
* and visualizations to their apps without having to include external libraries
* or embedding web views. We also wanted to harness the new features in the
* graphics pipeline to maximize performance.
* Features
*
* - Built-in support for many common types of charts
* including bar charts, line charts, stacked charts, scatter charts, pie charts
* and more.
* - Pinch Zoom - The
* {@link com.codename1.charts,ChartComponent} class includes optional pinch
* zoom support.
* - Panning Support - The
* {@link com.codename1.charts,ChartComponent} class includes optional support
* for panning.
*
*
Chart Types
*
* The com.codename1.charts package includes models and renderers
* for many different types of charts. It is also extensible so that you can add
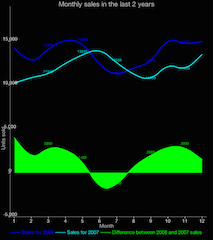
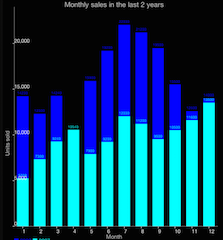
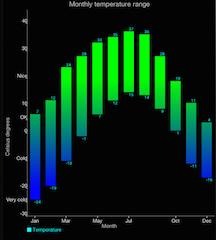
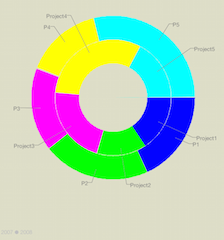
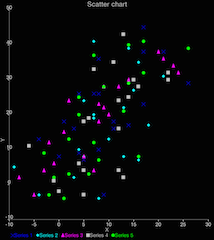
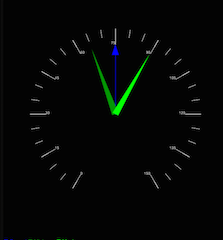
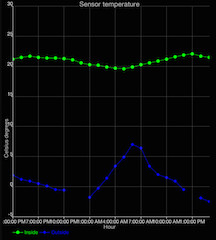
* your own chart types if required. The following screen shots demonstrate a
* small sampling of the types of charts that can be created.
*
*  *
*  *
*
*
*  *
*  *
*  *
*  *
*  *
*  *
*  *
*  *
*  *
*  *
*
*
*
* The above screenshots were taken from the
* ChartsDemo
* app. Y ou can start playing with this app by checking it out from our git
* repository.
*
*
* How to Create A Chart
*
* Adding a chart to your app involves four steps:
*
* - Build the model. You can construct a model (aka data
* set) for the chart using one of the existing model classes in the
*
com.codename1.charts.models package. Essentially, this is just
* where you add the data that you want to display.
* - Set up a renderer. You can create a renderer for your
* chart using one of the existing renderer classes in the
*
com.codename1.charts.renderers package. The renderer allows you
* to specify how the chart should look. E.g. the colors, fonts, styles, to use.
*
* - Create the Chart View. Use one of the existing
* view classes in the
*
com.codename1.charts.views package.
*
* - Create a {@link com.codename1.charts,ChartComponent} .
* In order to add your chart to the UI, you need to wrap it in a
* {@link com.codename1.charts,ChartComponent} object.
*
*
* You can check out the
* ChartsDemo
* app for specific examples, but here is a high level view of some code that
* creates a Pie Chart.
*
*
* The charts package is derived work from the excellent
* open source aChartEngine API.
*
*
* @author shannah
*/
public class ChartComponent extends Component {
private ArrayList animations = new ArrayList();
/**
* The chart that is to be rendered in this component.
*/
private AbstractChart chart;
/**
* Util object for rendering the chart.
*/
private final ChartUtil util = new ChartUtil();
/**
* The transform for the chart. This can be used to scale, translate, and
* rotate the chart. This transform assumes its origin at the (absoluteX, absoluteY)
* of the component at the time it is drawn rather than the screen's origin as is
* normally the case with transforms. This allows the transform to be applied consistently
* with respect to the chart's coordinates even when the component is moved around the screen.
*/
private Transform transform = null;
/**
* The transform that was applied during the last paint() method.
* This is generally the {@link #transform} concatenated with a
* translation to the screen origin from the component's origin. This
* is used to convert chart coordinates to screen coordinates and respond
* properly to events.
*/
private Transform currentTransform = null;
/**
* Flag to enable panning the chart. Default is false.
*/
private boolean panEnabled = false;
/**
* During a pan operation, used to store the transform as it was before
* the start of the pan.
*/
private Transform dragTransformStart = null;
private Transform tmpTransform = null;
/**
* The starting position of a pan operation.
*/
private Point dragStart = null;
/**
* Flag to enable pinch zoom.
*/
private boolean zoomEnabled = false;
/**
* During a pinch zoom operation, this is the middle point between the
* two touch points at the start of the zoom operation. This is in
* screen coordinates.
*/
private Point zoomStart = null;
/**
* During a pinch zoom operation, this is the transform as it was at the start
* of the zoom.
*/
private Transform zoomTransformStart = null;
/**
* During a pinch zoom operation, this is the distance between the two touch
* points at the start of the zoom operation.
*/
private double zoomDistStart = 0;
/**
* Creates a new chart component to display the provided chart.
* @param chart The chart to be displayed in this component.
*/
public ChartComponent(AbstractChart chart){
setUIID("ChartComponent");
this.chart = chart;
if (chart != null && chart instanceof XYChart) {
XYChart xyChart = (XYChart)chart;
zoomEnabled = xyChart.getRenderer().isZoomEnabled();
panEnabled = xyChart.getRenderer().isPanEnabled();
}
}
/**
* Gets the chart that is being displayed in this component.
* @return
*/
public AbstractChart getChart(){
return chart;
}
@Override
protected Dimension calcPreferredSize() {
return new Dimension(
Display.getInstance().convertToPixels(100, true),
Display.getInstance().convertToPixels(100, false)
);
}
/**
* Sets the chart to be displayed in this component.
* @param chart
*/
public void setChart(AbstractChart chart){
this.chart = chart;
}
/**
* Paints the chart.
* @param g
*/
@Override
public void paint(Graphics g) {
super.paint(g);
boolean oldAntialias = g.isAntiAliased();
g.setAntiAliased(true);
boolean transformed = false;
if ( getTransform() != null ){
transformed = true;
if (tmpTransform == null) {
tmpTransform = Transform.makeIdentity();
}
g.getTransform(tmpTransform);
if (currentTransform == null) {
currentTransform = Transform.makeTranslation(getAbsoluteX(), getAbsoluteY());
} else {
currentTransform.setTranslation(getAbsoluteX(), getAbsoluteY());
}
currentTransform.concatenate(transform);
currentTransform.translate(-getAbsoluteX(), -getAbsoluteY());
g.setTransform(currentTransform);
} else {
currentTransform = null;
}
util.paintChart(g, chart, getBounds(), getAbsoluteX(), getAbsoluteY());
if ( transformed){
g.setTransform(tmpTransform);
}
g.setAntiAliased(oldAntialias);
}
/**
* Converts screen coordinates to chart coordinates.
* @param x screen x position
* @param y screen y position
* @return The chart coordinate corresponding to the given screen coordinate.
*/
public Point screenToChartCoord(int x, int y){
if ( currentTransform != null ){
Transform inverse = currentTransform.getInverse();
float[] pt = inverse.transformPoint(new float[]{x,y, 0});
x = (int)pt[0];
y = (int)pt[1];
}
return new Point(x-getAbsoluteX(), y-getAbsoluteY());
}
/**
* Returns the screen position from a chart coordinate
*
* @param x the x position within the chart
* @param y the y position within the chart
* @return a position within the screen
*/
public Point chartToScreenCoord(int x, int y){
x += getAbsoluteX();
y += getAbsoluteY();
if ( currentTransform != null ){
float[] pt = currentTransform.transformPoint(new float[]{x,y, 0});
x = (int)pt[0];
y = (int)pt[1];
}
return new Point(x, y);
}
/**
* Converts a chart coordinate spaced shape to the same shape in the screen coordinate space
* @param s shape in screen coordinates
* @return same shape using chart space coordinates
*/
public Shape screenToChartShape(Shape s){
GeneralPath p = new GeneralPath();
Transform t = Transform.makeIdentity();
if ( currentTransform != null ){
t.concatenate(currentTransform.getInverse());
}
t.translate(-getAbsoluteX(), -getAbsoluteY());
p.append(s.getPathIterator(t), false);
return p;
}
/**
* Converts a screen coordinate spaced shape to the same shape in the chart coordinate space
* @param s shape in chart coordinates
* @return same shape using screen coordinate space
*/
public Shape chartToScreenShape(Shape s){
GeneralPath p = new GeneralPath();
Transform inverse = Transform.makeTranslation(getAbsoluteX(), getAbsoluteY());
if ( currentTransform != null ){
inverse.concatenate(currentTransform);
}
p.append(s.getPathIterator(inverse), false);
return p;
}
/**
* Zooms the view port to show a specified shape. The shape should be
* expressed in chart coordinates (not screen coordinates).
* @param s The shape that should be shown.
*/
public void zoomToShapeInChartCoords(Shape s){
zoomToShapeInChartCoords(s, 1);
}
/**
* Zooms the view port to show a specified shape. The shape should be
* expressed in chart coordinates (not screen coordinates).
* @param s The shape that should be shown.
* @param duration The duration of the transition.
* @see #zoomTo(double, double, double, double, int)
*/
public void zoomToShapeInChartCoords(Shape s, int duration){
Rectangle r = s.getBounds();
zoomTransition(r.getX(), r.getX() + r.getWidth(), r.getY(), r.getY() + r.getHeight(), duration);
}
/**
* Zooms the chart in an animated fashion to the specified axis ranges. This is effectively
* the same as using {@link #zoomToShapeInChartCoords(com.codename1.ui.geom.Shape, int) } except
* it allows you to specify coordinates as doubles.
*
* @param minX The lower bound of the X-axis after zoom.
* @param maxX The upper bound of the X-axis after zoom.
* @param minY The lower bound of the Y-axis after zoom.
* @param maxY THe upper bound of the Y-axis after zoom.
* @param duration Transition time (ms).
*/
public void zoomTo(double minX, double maxX, double minY, double maxY, int duration) {
zoomTransition(minX, maxX, minY, maxY, duration);
}
@Override
public void pointerPressed(int x, int y) {
Point chartCoord = screenToChartCoord(x, y);
SeriesSelection sel = chart.getSeriesAndPointForScreenCoordinate(chartCoord);
if ( sel == null ){
super.pointerPressed(x, y);
return;
}
seriesPressed(sel);
super.pointerPressed(x, y); //To change body of generated methods, choose Tools | Templates.
}
/**
* Called when a pointer is pressed on a series in the chart. This can be
* overridden by subclasses to respond to this event.
* @param sel
*/
protected void seriesPressed(SeriesSelection sel){
}
@Override
public void pointerReleased(int x, int y) {
dragStart = null;
zoomStartBBox = null;
dragStartBBox = null;
dragTransformStart = null;
zoomStart = null;
zoomDistStart = 0;
zoomTransformStart = null;
Point chartCoord = screenToChartCoord(x, y);
SeriesSelection sel = chart.getSeriesAndPointForScreenCoordinate(chartCoord);
if ( sel == null ){
super.pointerReleased(x, y);
return;
}
seriesReleased(sel);
super.pointerReleased(x, y); //To change body of generated methods, choose Tools | Templates.
}
/**
* Called when a pointer is released from a series in the chart. This can be
* overridden in subclasses to handle these events.
* @param sel
*/
protected void seriesReleased(SeriesSelection sel){
}
/**
*
* Gets the transform for the chart. This can be used to scale, translate, and
* rotate the chart. This transform assumes its origin at the (absoluteX, absoluteY)
* of the component at the time it is drawn rather than the screen's origin as is
* normally the case with transforms. This allows the transform to be applied consistently
* with respect to the chart's coordinates even when the component is moved around the screen.
* @return The transform for the chart in component coordinates.
*/
public Transform getTransform() {
return transform;
}
/**
* Sets the transform for the chart. Transforms origin assumed to be at (getAbsoluteX, getAbsoluteY).
* @param transform the transform to set
*/
public void setTransform(Transform transform) {
this.transform = transform;
}
private BBox dragStartBBox;
private BBox zoomStartBBox;
private double zoomDistStartX, zoomDistStartY;
private BBox initialZoomBBox;
@Override
public void pointerDragged(int[] x, int[] y) {
if ( x.length > 1 ){
if ( !zoomEnabled ){
super.pointerDragged(x, y);
return;
}
// Pinch zoom
if (chart instanceof XYChart) {
XYChart xyChart = (XYChart)chart;
double[] panLimits = xyChart.getRenderer().getPanLimits();
if ( zoomStart == null ){
zoomStart = new Point((x[0]+x[1])/2, (y[0]+y[1])/2);
zoomDistStartX = Math.abs(x[0]-x[1]);
zoomDistStartY = Math.abs(y[0]-y[1]);
zoomStartBBox = getBBox();
if (initialZoomBBox == null) {
initialZoomBBox = zoomStartBBox.translateScreenCoords(0, 0);
}
} else {
int dx = Math.abs(x[0]-x[1]);
int dy = Math.abs(y[0]-y[1]);
if (dx == 0) dx = 1;
if (dy == 0) dy = 1;
double zoomX = zoomDistStartX/dx;
double zoomY = zoomDistStartY/dy;
BBox newBounds = zoomStartBBox.scaleScreenCoords((float)zoomX, (float)zoomY);
double minX = newBounds.minX;
double minY = newBounds.minY;
double maxX = newBounds.maxX;
double maxY = newBounds.maxY;
if (panLimits != null) {
// Make sure that this zoom doesn't exceed the maxZoomIn value
if (minX < panLimits[0]) {
maxX = maxX + panLimits[0] - minX;
minX = panLimits[0];
}
if (minY < panLimits[2]) {
maxY = maxY + panLimits[2] - minY;
minY = panLimits[2];
}
if (maxX > panLimits[1]) {
minX = minX + panLimits[1] - maxX;
maxX = panLimits[1];
}
if (maxY > panLimits[3]) {
minY = minY + panLimits[3] - maxY;
maxY = panLimits[3];
}
}
double[] zoomLimits = xyChart.getRenderer().getZoomLimits();
if (zoomLimits != null && zoomLimits[0] != 0) {
if (maxX - minX < zoomLimits[0]) {
maxX = xyChart.getRenderer().getXAxisMax();
minX = xyChart.getRenderer().getXAxisMin();
}
}
if (zoomLimits != null && zoomLimits[1] != 0) {
if (maxX - minX > zoomLimits[1]) {
maxX = xyChart.getRenderer().getXAxisMax();
minX = xyChart.getRenderer().getXAxisMin();
}
}
if (zoomLimits != null && zoomLimits[2] != 0) {
if (maxY - minY < zoomLimits[2]) {
maxY = xyChart.getRenderer().getYAxisMax();
minY = xyChart.getRenderer().getYAxisMin();
}
}
if (zoomLimits != null && zoomLimits[3] != 0) {
if (maxY - minY > zoomLimits[3]) {
maxY = xyChart.getRenderer().getYAxisMax();
minY = xyChart.getRenderer().getYAxisMin();
}
}
if (!xyChart.getRenderer().isZoomXEnabled()) {
minX = xyChart.getRenderer().getXAxisMin();
maxX = xyChart.getRenderer().getXAxisMax();
}
if (!xyChart.getRenderer().isZoomYEnabled()) {
minY = xyChart.getRenderer().getYAxisMin();
maxY = xyChart.getRenderer().getYAxisMax();
}
xyChart.getRenderer().setRange(new double[]{minX, maxX, minY, maxY});
chartBoundsChanged();
this.repaint();
}
} else {
if ( zoomStart == null ){
zoomStart = new Point((x[0]+x[1])/2, (y[0]+y[1])/2);
zoomTransformStart = Transform.makeIdentity();
if ( transform != null ){
zoomTransformStart.concatenate(transform);
}
int dx = Math.abs(x[0]-x[1])/2;
int dy = Math.abs(y[0]-y[1])/2;
zoomDistStart = Math.sqrt(dx*dx+dy*dy);
} else {
int dx = Math.abs(x[0]-x[1])/2;
int dy = Math.abs(y[0]-y[1])/2;
double zoomDist = Math.sqrt(dx*dx+dy*dy);
if ( zoomDist == 0 ){
zoomDist = 1;
}
transform = Transform.makeIdentity();
transform.translate(zoomStart.getX(), zoomStart.getY());
transform.scale((float)(zoomDist/zoomDistStart), (float)(zoomDist/zoomDistStart));
transform.translate(-zoomStart.getX(), -zoomStart.getY());
transform.concatenate(zoomTransformStart);
this.repaint();
}
}
} else {
if ( !isPanEnabled() ){
super.pointerDragged(x, y);
return;
}
if (chart instanceof XYChart) {
XYChart xyChart = (XYChart)chart;
double panLimits[] = xyChart.getRenderer().getPanLimits();
if (dragStartBBox == null) {
dragStart = new Point(x[0], y[0]);
dragStartBBox = getBBox();
} else {
float tx = x[0] - dragStart.getX();
float ty = y[0] - dragStart.getY();
BBox newBounds = dragStartBBox.translateScreenCoords(-tx, ty);
double minX = newBounds.minX;
double minY = newBounds.minY;
double maxX = newBounds.maxX;
double maxY = newBounds.maxY;
if (panLimits != null) {
if (minX < panLimits[0]) {
maxX = maxX + panLimits[0] - minX;
minX = panLimits[0];
}
if (minY < panLimits[2]) {
maxY = maxY + panLimits[2] - minY;
minY = panLimits[2];
}
if (maxX > panLimits[1]) {
minX = minX + panLimits[1] - maxX;
maxX = panLimits[1];
}
if (maxY > panLimits[3]) {
minY = minY + panLimits[3] - maxY;
maxY = panLimits[3];
}
}
if (!xyChart.getRenderer().isPanXEnabled()) {
minX = xyChart.getRenderer().getXAxisMin();
maxX = xyChart.getRenderer().getXAxisMax();
}
if (!xyChart.getRenderer().isPanYEnabled()) {
minY = xyChart.getRenderer().getYAxisMin();
maxY = xyChart.getRenderer().getYAxisMax();
}
xyChart.getRenderer().setRange(new double[]{minX, maxX, minY, maxY});
chartBoundsChanged();
}
} else {
if ( dragStart == null ){
dragStart = new Point(x[0],y[0]);
dragTransformStart = Transform.makeIdentity();
if ( transform != null ){
dragTransformStart.concatenate(transform);
}
} else {
transform = Transform.makeIdentity();
transform.translate(x[0]-dragStart.getX(), y[0]-dragStart.getY());
transform.concatenate(dragTransformStart);
this.repaint();
}
}
}
super.pointerDragged(x, y); //To change body of generated methods, choose Tools | Templates.
}
/**
* Checks if panning is enabled.
* @return the panEnabled
*/
public boolean isPanEnabled() {
if (chart instanceof XYChart) {
((XYChart)chart).getRenderer().isPanEnabled();
}
return panEnabled;
}
/**
* @param panEnabled the panEnabled to set
*/
public void setPanEnabled(boolean panEnabled) {
this.panEnabled = panEnabled;
if (chart instanceof XYChart) {
XYChart xyChart = (XYChart)chart;
xyChart.getRenderer().setPanEnabled(panEnabled);
}
}
/**
* Enables or disables pan on x and y axes separately.
* @param panXEnabled True to enable panning along the x-axis.
* @param panYEnabled True to enable panning along the y-axis.
*/
public void setPanEnabled(boolean panXEnabled, boolean panYEnabled) {
this.panEnabled = panXEnabled || panYEnabled;
if (chart instanceof XYChart) {
XYChart xyChart = (XYChart)chart;
xyChart.getRenderer().setPanEnabled(panXEnabled, panYEnabled);
}
}
/**
* Checks whether panning is enabled along the X-axis.
* @return
*/
public boolean isPanXEnabled() {
if (chart instanceof XYChart) {
return ((XYChart)chart).getRenderer().isPanXEnabled();
}
return panEnabled;
}
/**
* Checks whether panning is enabled along the Y-axis.
* @return
*/
public boolean isPanYEnabled() {
if (chart instanceof XYChart) {
return ((XYChart)chart).getRenderer().isPanYEnabled();
}
return panEnabled;
}
/**
* Sets the pan limits if panning is enabled.
* @param minX The minimum X-axis value for panning.
* @param maxX The maximum X-axis value for panning.
* @param minY The minimum Y-axis value for panning.
* @param maxY The maximum Y-axis value for panning.
*/
public void setPanLimits(double minX, double maxX, double minY, double maxY) {
if (chart instanceof XYChart) {
XYChart xyChart = (XYChart)chart;
XYMultipleSeriesRenderer r = xyChart.getRenderer();
r.setPanLimits(new double[]{minX, maxX, minY, maxY});
} else {
throw new RuntimeException("setPanLimits() only supported for XYCharts");
}
}
/**
* Removes the pan limits which may have been previously set with {@link #setPanLimits(double, double, double, double) }
*/
public void clearPanLimits() {
if (chart instanceof XYChart) {
((XYChart)chart).getRenderer().setPanLimits(null);
}
}
/**
* Checks whether zoom is enabled.
* @return the zoomEnabled
*/
public boolean isZoomEnabled() {
if (chart instanceof XYChart) {
((XYChart)chart).getRenderer().isZoomEnabled();
}
return zoomEnabled;
}
/**
* Checks whether zoom is enabled on the X-axis.
* @return
*/
public boolean isZoomXEnabled() {
if (chart instanceof XYChart) {
return ((XYChart)chart).getRenderer().isZoomXEnabled();
}
return zoomEnabled;
}
/**
* Checks whether zoom is enabled on the Y-axis.
* @return
*/
public boolean isZoomYEnabled() {
if (chart instanceof XYChart) {
return ((XYChart)chart).getRenderer().isZoomYEnabled();
}
return zoomEnabled;
}
/**
* Enables or disables zoom on both x and y axes.
* @param zoomEnabled the zoomEnabled to set
*/
public void setZoomEnabled(boolean zoomEnabled) {
this.zoomEnabled = zoomEnabled;
setFocusable(isFocusable() || zoomEnabled);
if (chart instanceof XYChart) {
XYChart xyChart = (XYChart)chart;
xyChart.getRenderer().setZoomEnabled(zoomEnabled, zoomEnabled);
}
}
/**
* Sets the zoom limits.
*
* NOTE: This method is only applicable when showing an {@link XYChart } It will throw a
* RuntimeException if called while a different kind of chart is being shown.
*
* @param minRangeX The minimum distance from {@link XYMultipleSeriesRenderer#getXAxisMin() } to
* {@link XYMultipleSeriesRenderer#getXAxisMax() } that can be achieved by zooming in. {@literal 0} means no limit.
* @param maxRangeX The maximum distance from {@link XYMultipleSeriesRenderer#getXAxisMin() } to
* {@link XYMultipleSeriesRenderer#getXAxisMax() } that can be achieved by zooming out. {@literal 0} means no limit.
* @param minRangeY The minimum distance from {@link XYMultipleSeriesRenderer#getYAxisMin() } to
* {@link XYMultipleSeriesRenderer#getYAxisMax() } that can be achieved by zooming in. {@literal 0} means no limit.
* @param maxRangeY The maximum distance from {@link XYMultipleSeriesRenderer#getYAxisMin() } to
* {@link XYMultipleSeriesRenderer#getYAxisMax() } that can be achieved by zooming out. {@literal 0} means no limit.
*/
public void setZoomLimits(double minRangeX, double maxRangeX, double minRangeY, double maxRangeY) {
if (chart instanceof XYChart) {
XYChart xyChart = (XYChart)chart;
xyChart.getRenderer().setZoomLimits(new double[]{minRangeX, maxRangeX, minRangeY, maxRangeY});
} else {
throw new RuntimeException("setZoomLimits() only supported for XY charts");
}
}
/**
* Enables or disables zoom on x and y axes separately.
* @param zoomX True to enable zooming x axis.
* @param zoomY True to enable zooming y axis.
*/
public void setZoomEnabled(boolean zoomX, boolean zoomY) {
this.zoomEnabled = zoomX || zoomY;
setFocusable(isFocusable() || zoomEnabled);
if (chart instanceof XYChart) {
((XYChart)chart).getRenderer().setZoomEnabled(zoomX, zoomY);
}
}
private void zoomTransition(double minX, double maxX, double minY, double maxY, int duration){
if (chart instanceof XYChart) {
BBox currentViewPort = getBBox();
BBox targetViewPort = getBBox(
minX, maxX,
minY, maxY,
(int)currentViewPort.topLeft.getX(), (int)currentViewPort.topLeft.getY(),
(int)currentViewPort.bottomRight.getX(), (int)currentViewPort.bottomRight.getY()
);
ZoomTransitionXY zt = new ZoomTransitionXY(currentViewPort, targetViewPort, duration);
animations.add(zt);
if (animations.size() == 1) {
zt.start();
}
} else {
Shape currentViewPort = screenToChartShape(new Rectangle(getAbsoluteX(), getAbsoluteY(), getWidth(), getHeight()));
float[] currentRect = currentViewPort.getBounds2D();
float[] newRect = new float[]{(float)minX, (float)(maxX-minX), (float)minY, (float)(maxY-minY)};
float currentAspect =currentRect[2]/currentRect[3];
float newAspect = newRect[3]/newRect[3];
Rectangle newViewPort = new Rectangle((int)newRect[0], (int)newRect[1], (int)newRect[2], (int)newRect[3]);
if ( newAspect != currentAspect ){
newViewPort.setHeight((int)(((double)newViewPort.getWidth())/currentAspect));
newRect = newViewPort.getBounds2D();
newAspect = newRect[2]/newRect[3];
}
ZoomTransition zt = new ZoomTransition(currentViewPort.getBounds(), newViewPort, duration);
animations.add(zt);
if ( animations.size() == 1 ){
zt.start();
}
}
}
private interface IZoomTransition {
public void start();
}
private class ZoomTransition implements Animation, IZoomTransition {
private final Rectangle currentViewPort;
private final Rectangle newViewPort;
private Motion motion;
private final Transform origTransform;
private boolean finished = false;
ZoomTransition(Rectangle currentViewPort, Rectangle newViewPort, int duration){
this.currentViewPort = currentViewPort;
this.newViewPort = newViewPort;
this.motion = Motion.createLinearMotion(0, 100, duration);
this.origTransform = Transform.makeIdentity();
if ( transform != null ){
this.origTransform.setTransform(transform);
}
}
public void start(){
Form f = ChartComponent.this.getComponentForm();
if ( f != null ){
f.registerAnimated(this);
this.motion.start();
} else {
animations.remove(this);
}
}
public void cleanup(){
Form f = ChartComponent.this.getComponentForm();
if ( f != null ){
f.deregisterAnimated(this);
}
}
public boolean animate() {
if (finished){
animations.remove(this);
if ( !animations.isEmpty() ){
animations.get(0).start();
}
cleanup();
return false;
} else if ( motion.isFinished() ){
finished = true;
}
return true;
}
public void paint(Graphics g) {
Rectangle newBounds = new Rectangle(newViewPort.getBounds());
Rectangle currentBounds = new Rectangle(currentViewPort.getBounds());
double nW = newBounds.getWidth();
double nH = newBounds.getHeight();
double cW = currentBounds.getWidth();
double cH = currentBounds.getHeight();
double scale = cW/nW;
if ( nH * scale > cH){
scale = cH/nH;
}
Point newCenter = new Point(newBounds.getX()+newBounds.getWidth()/2, newBounds.getY()+newBounds.getHeight()/2);
Point currentCenter = new Point(currentBounds.getX()+currentBounds.getWidth()/2, currentBounds.getY()+currentBounds.getHeight()/2);
double motionVal = motion.getValue();
double tx = ((double)newCenter.getX()-currentCenter.getX())*motionVal/100.0;
double ty = ((double)newCenter.getY()-currentCenter.getY())*motionVal/100.0;
scale = 1.0 + (scale - 1f)*motionVal/100.0;
Transform t = Transform.makeIdentity();
t.setTransform(origTransform);
int cX = (int)(currentCenter.getX()+tx);
int cY = (int)(currentCenter.getY()+ty);
t.translate(currentCenter.getX(), currentCenter.getY());
t.scale((float)scale, (float)scale);
t.translate(-cX, -cY);
setTransform(t);
ChartComponent.this.repaint();
}
}
private class ZoomTransitionXY implements Animation, IZoomTransition {
private final BBox currentViewPort;
private final BBox newViewPort;
private final Motion motion;
private boolean finished = false;
ZoomTransitionXY(BBox currentViewPort, BBox newViewPort, int duration){
this.currentViewPort = currentViewPort;
this.newViewPort = newViewPort;
this.motion = Motion.createLinearMotion(0, 100, duration);
}
public void start(){
Form f = ChartComponent.this.getComponentForm();
if ( f != null ){
f.registerAnimated(this);
this.motion.start();
} else {
animations.remove(this);
}
}
public void cleanup(){
Form f = ChartComponent.this.getComponentForm();
if ( f != null ){
f.deregisterAnimated(this);
}
}
public boolean animate() {
if (finished){
animations.remove(this);
if ( !animations.isEmpty() ){
animations.get(0).start();
}
cleanup();
return false;
} else if ( motion.isFinished() ){
chartBoundsChanged();
finished = true;
}
return true;
}
public void paint(Graphics g) {
if (chart instanceof XYChart) {
XYChart xyChart = (XYChart)chart;
double motionVal = motion.getValue() / 100.0;
double diff = newViewPort.minX - currentViewPort.minX;
double minX = currentViewPort.minX + diff * motionVal;
diff = newViewPort.maxX - currentViewPort.maxX;
double maxX = currentViewPort.maxX + diff * motionVal;
diff = newViewPort.minY - currentViewPort.minY;
double minY = currentViewPort.minY + diff * motionVal;
diff = newViewPort.maxY - currentViewPort.maxY;
double maxY = currentViewPort.maxY + diff * motionVal;
xyChart.getRenderer().setXAxisMin(minX);
xyChart.getRenderer().setXAxisMax(maxX);
xyChart.getRenderer().setYAxisMin(minY);
xyChart.getRenderer().setYAxisMax(maxY);
ChartComponent.this.repaint();
}
}
}
private class BBox {
// screen coords
Point topLeft;
Point bottomRight;
// Chart coords
double minX, maxX, minY, maxY;
double scaleX, scaleY;
BBox translateScreenCoords(float x, float y) {
BBox out = new BBox();
out.topLeft = new Point(topLeft.getX() + x, topLeft.getY() + y);
out.bottomRight = new Point(bottomRight.getX() + x, topLeft.getY() + y);
float tXChart = (float)( x / scaleX);
float tYChart = (float)(y / scaleY);
out.minX = minX + tXChart;
out.maxX = maxX + tXChart;
out.minY = minY + tYChart;
out.maxY = maxY + tYChart;
out.scaleX = scaleX;
out.scaleY = scaleY;
return out;
}
BBox scaleScreenCoords(float x, float y) {
BBox out = new BBox();
Point center = new Point(
0.5f * (topLeft.getX() + bottomRight.getX()),
0.5f * (topLeft.getY() + bottomRight.getY())
);
double cX = (minX + maxX)/2;
double cY = (minY + maxY)/2;
float width = (bottomRight.getX() - topLeft.getX()) * x;
float height = (bottomRight.getY() - topLeft.getY()) * y;
out.topLeft = new Point(center.getX() - width/2, center.getY() - height/2);
out.bottomRight = new Point(center.getX() + width/2, center.getY() + height/2);
//float tXChart = (float)( x / scaleX);
//float tYChart = (float)(y / scaleY);
out.minX = cX - width/2/scaleX;
out.maxX = cX + width/2/scaleX;
out.minY = cY - height/2/scaleY;
out.maxY = cY + height/2/scaleY;
out.scaleX = scaleX;
out.scaleY = scaleY;
return out;
}
}
private BBox getBBox() {
if (chart instanceof XYChart) {
XYChart xyChart = (XYChart)chart;
double minX = xyChart.getRenderer().getXAxisMin();
double maxX = xyChart.getRenderer().getXAxisMax();
double minY = xyChart.getRenderer().getYAxisMin();
double maxY = xyChart.getRenderer().getYAxisMax();
return getBBox(minX, maxX, minY, maxY,
getAbsoluteX() + getStyle().getPaddingLeft(false) + xyChart.getRenderer().getMargins()[1],
getAbsoluteY() + getStyle().getPaddingTop() + xyChart.getRenderer().getMargins()[0],
getAbsoluteX() + getWidth() - getStyle().getPaddingRight(false) - xyChart.getRenderer().getMargins()[3],
getAbsoluteY() + getHeight() - getStyle().getPaddingBottom() - xyChart.getRenderer().getMargins()[2]);
}
return null;
}
private BBox getBBox(double minX, double maxX, double minY, double maxY, int topLeftX, int topLeftY, int bottomRightX, int bottomRightY) {
Point topLeft = new Point(topLeftX, topLeftY);
Point bottomRight = new Point(bottomRightX, bottomRightY);
if (bottomRight.getX() == topLeft.getX() || topLeft.getY() == bottomRight.getY()) {
// If the we don't have height or width, forget about scaling
return null;
}
double xScale = (bottomRight.getX() - topLeft.getX()) / (maxX - minX);
double yScale = (bottomRight.getY() - topLeft.getY()) / (maxY - minY);
BBox out = new BBox();
out.topLeft = topLeft;
out.bottomRight = bottomRight;
out.minX = minX;
out.maxX = maxX;
out.minY = minY;
out.maxY = maxY;
out.scaleX =xScale;
out.scaleY = yScale;
return out;
}
/**
* Subclasses can override this method to be informed when the chart bounds change
* due to panning or zooming.
*/
protected void chartBoundsChanged() {
}
}
